
Dashboards You Build and Edit Yourself
Describe a dashboard, edit it in seconds, download the policies behind any tile
What if building an analytics dashboard were as easy as describing it? And what if changing it later didn't mean filing a ticket with your vendor?
Describe it, and it's built
In ennabl AI, just say what you want to see, such as "in-force premium by line and by carrier," and it builds a saved, reusable dashboard on your Analytics page: charts, KPIs and interactive filters, with an in-force / YTD / rolling-12 selector.
It's never a stale snapshot. Every chart runs a live query against your book of business each time you open it. Build it once, share it with your team, and it stays current.
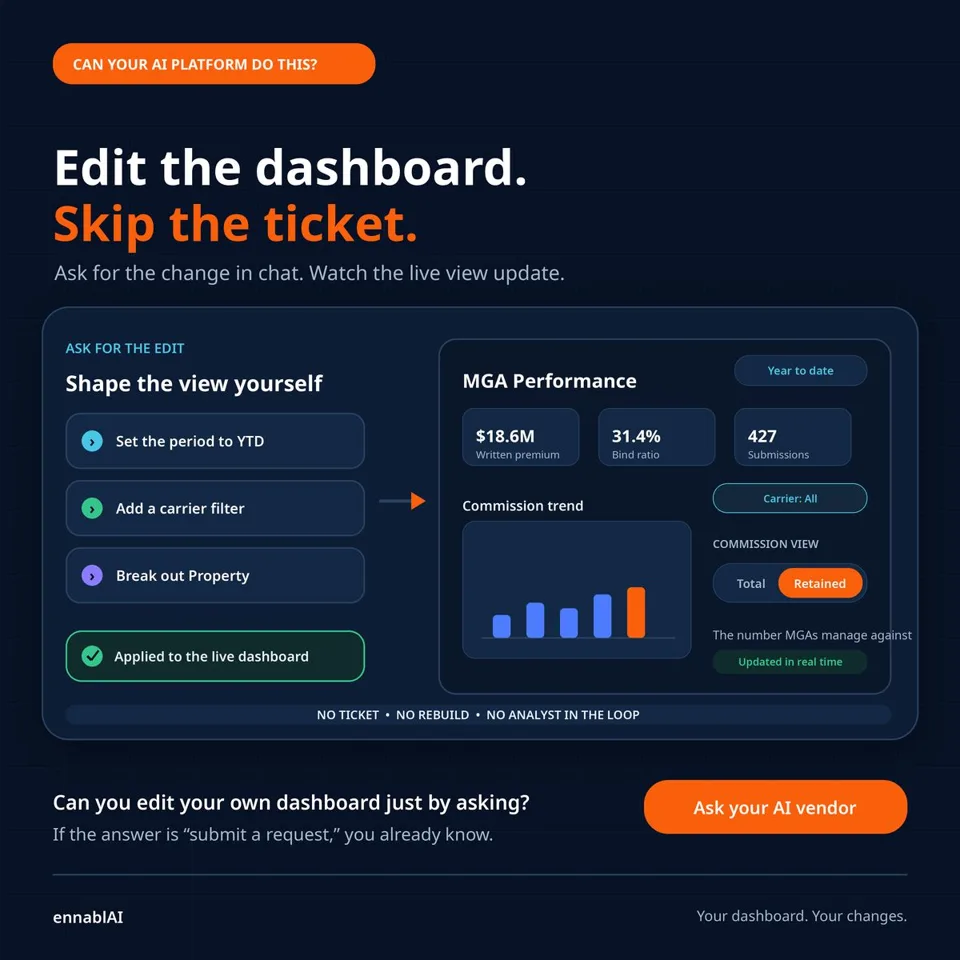
Edit it yourself, just by asking
Ask your AI vendor a simple question: when you want a dashboard or report changed, who does the work? You, or someone on their team?
Most platforms treat a dashboard as something delivered, not something you own. A different date range, a new filter or a line of business broken out on its own becomes a ticket, and you wait for someone to make the change.
- Edit any live dashboard or report by asking for the change in chat.
- No ticket, no rebuild, no analyst in the loop.
- The view changes in front of you as you refine it.
Get the list behind the number
Your dashboard shows 42 renewals in the next 30 days. Now what? Most platforms stop at the chart. The moment you need to work that list, you're exporting to Excel or asking someone to pull it.
- Click into any dashboard tile and download the policies behind it.
- Every total resolves to a working list you can sort, filter and act on.
A dashboard that only shows totals is a report. A dashboard that hands you the list behind the total is something you can work. Generating a chart is the easy part; connecting it back to real, usable records is the hard one.
Try it free at ennabl.ai